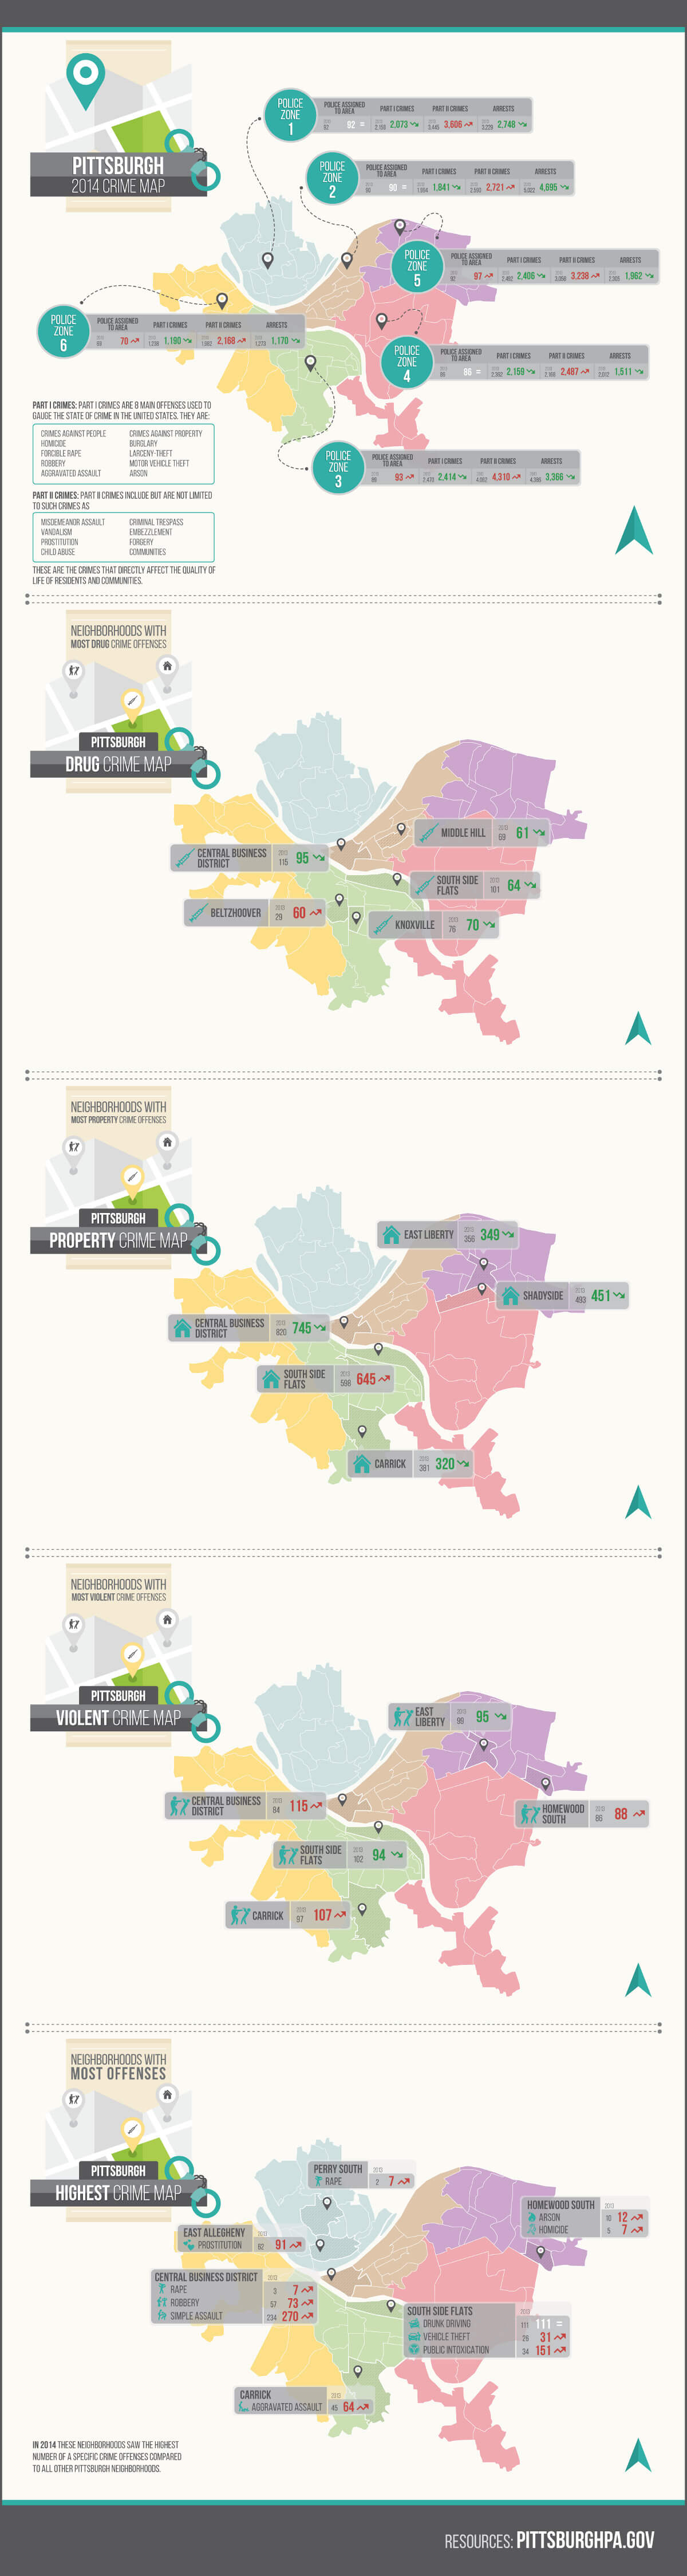
Pittsburgh 2014 Crime Map
Although property crimes and violent crimes — together known as Part I Crimes — were down overall, the city of Pittsburgh saw a significant increase in murders and some other types of violent crime in 2014 over 2013.
Murders increased by an alarming rate of 50 percent, from 46 in 2013 to 71 in 2014. The total number of murders was at its highest in five years, and the city had solved fewer of the cases than at any time during that period.
Much of the increase in violence is due to the drug trade, Allegheny County’s district attorney reported. The neighborhood with the most drug offenses was Central Business District with 95, a decrease from 115 in the previous year. Other neighborhoods that ranked highest among drug offenses were Middle Hill, South Side Flats, Knoxville and Beltzhoover. Among them, only Beltzhoover saw an increase in drug crimes, from 29 in 2013 to 60 in 2014.
An Increase in Violent Crimes
In addition to murders, rapes also increased, from 90 in 2013 to 97 in 2014 for an increase of 7.8 percent. Aggravated assaults were up from 1,259 in 2013 to 1,321 in 2014, an increase of 4.9 percent. In the violent crime category, the city experienced a decrease only in robberies, from 967 in 2013 to 947 in 2014, for a drop of 2.1 percent. Overall, violent crimes in the city were up 3 percent in 2014 over the prior year.
Property crimes, on the other hand, experienced an overall decrease, along with decreases in each category:
- Burglary, down 5.4 percent.
- Larceny, down 6 percent.
- Vehicle theft, down 14.6 percent.
- Arson, down 15.5 percent.
Overall, property crimes in the city saw a decrease of 6.6 percent in 2014 from the previous year. Together, property crimes and violent crimes are known as Part I Crimes, which showed an overall decrease of 4.8 percent in the city in 2014.
Hardest-Hit Pittsburgh Neighborhoods
Some of the city’s neighborhoods took the worst hit when it came to crime in 2014. The Chateau neighborhood had the highest crime rate, at more than 1,590 total crimes per 100 citizens. However, that neighborhood had only 11 residents, according to 2010 population statistics.
New Homestead, on the other hand, with 990 residents, appeared to have one of the lowest rates at 2.12 crimes per 100 citizens. Other neighborhoods with crime rates that outpaced the rest of the city included:
- South Shore, 1,031.58 crimes per 100 citizens.
- North Shore, 139.6 crimes per 100 citizens.
- Strip District, 54.87 crimes per 100 citizens.
- Central Business District, 48.03 crimes per 100 citizens.
- West End, 44.49 crimes per 100 citizens.
No other neighborhoods reported more than 40 crimes per 100 citizens, according to the City of Pittsburgh Department of Public Safety.
Contact Experienced Criminal Defense Attorneys
If you’re charged with a criminal offense, consult with professional attorneys experienced in all forms of criminal defense law. For a free consultation about your case, contact the Pittsburgh law offices of DeLuca, Ricciuti & Konieczka.