Pittsburgh Neighborhood Crime
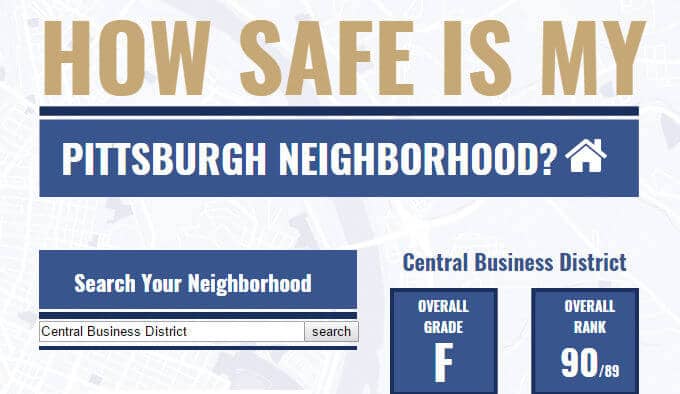
How safe is your neighborhood? Our interactive search tool allows you to search by Pittsburgh neighborhood to see a variety of statistics, including the number of violent crimes along with those related to property and drugs.
We’ve ranked the 89 neighborhoods in the city and given them a letter grade, with A being the safest and F being the least safe. Most Pittsburgh neighborhoods ranked well; in fact, only 24 received grades below a B. Only four ranked as E or F. The numbers are based on crime statistics from 2012 to 2015 from the City of Pittsburgh Bureau of Police.
Best Neighborhoods in Pittsburgh
More than a third of the city’s neighborhoods — 36 of 89 — received a grade of A. The top spot went to Regent Square, with only four violent crimes reported for the year. Property crimes stood at 20 and drug crimes at three.
The Ridgemont neighborhood ranked second-safest, with seven violent crimes, 18 property crimes and two drug crimes. Swisshelm Park was third with only five violent crimes, 23 property crimes and one drug crime.
Rounding out the top five safest Pittsburgh neighborhoods were Chartiers City, with 11 violent crimes, 17 property crimes and six drug crimes; and Bon Air, with 18 violent crimes, 27 property crimes and 18 drug crimes.
Violent Crimes in Pittsburgh
Three Pittsburgh neighborhoods received an F rating and ranked as the worst when it came to violent crime. The Central Business District, with 314 violent crimes reported, received the least-favorable ranking.
Carrick placed second for violent areas of the city, with 306 crimes related to violence. South Side Flats ranked third, with 253 violent crimes for the period.
Property Crimes
The same three neighborhoods also ranked as the city’s worst for property crimes. The Central Business District had the highest number of property crimes at 977. South Side Flats ranked second, with 652 crimes related to property. Carrick was rated third-worst, with 591 property-related criminal offenses.
Drug Crimes
South Side Flats had the highest number of drug crimes for the period at 245. Other neighborhoods with high numbers of alcohol and drug crime reports included the Central Business District, with 207 drug-related crimes. South Side Slopes reported 140 drug crimes for the period, and East Allegheny had 98. The Carrick neighborhood ranked fifth-worst in the city for drug crimes, with 94.
Zone Totals
To see crime data for your Pittsburgh zone, hover your mouse over the interactive map. Zone 1 had the highest number of violent crime reports, at 1,710. The highest number of property-related crimes and drug crimes were reported in Zone 3, at 3,011 and 748.
Our Grading System
To rank the neighborhoods, the Pittsburgh law office of DeLuca, Ricciuti & Konieczka reviewed crime data provided by the city’s police department for 2012 to 2015. After totaling violent crimes, property crimes, and drug and alcohol crimes for each year, we averaged the numbers across the four years.
Violent crimes included weapons violations, simple assaults, homicides, rapes and assaults. Property crimes included robberies, burglaries, thefts, vehicle thefts, arsons, and cases of fraud, embezzlement, stolen property, and vandalism. Drug- and alcohol-related crimes included drug violations, driving under the influence, and drunkenness.
We calculated letter grades by assigning weight to specific crimes as follows:
- Violent crimes were weighted at 0.6.
- Property crimes were weighted at 0.3.
- Alcohol and drug crimes were weighted at 0.1.
Letter grades were assigned based on total points:
- A: 0 to 67 points.
- B: 68 to 133 points.
- C: 134 to 199 points.
- D: 200 to 267 points.
- F: 268 points and higher.
Get Assistance if You’re Charged With a Crime
Have you been charged with a crime in Pittsburgh? Whether the charges relate to drugs or alcohol, property, or violence, a criminal conviction can result in harsh penalties and difficulty finding employment in the future. By working with an experienced criminal defense attorney, you take an important step to protect your rights and move past this difficult time of your life. For a free consultation, contact the Office of DeLuca, Ricciuti & Konieczka.
Pittsburgh Neighborhood Crime Data
| Neighborhood | Total Violent Crime | Total Property Crime | Total Drug Crime | Total Score | Total Grade | |
|---|---|---|---|---|---|---|
| Regent Square | 4 | 20 | 3 | 9 | A | |
| Ridgemont | 7 | 18 | 2 | 10 | A | |
| Swisshelm Park | 5 | 23 | 1 | 10 | A | |
| Chartiers City | 11 | 17 | 6 | 12 | A | |
| Bon Air | 18 | 27 | 18 | 21 | A | |
| New Homestead | 18 | 29 | 12 | 21 | A | |
| Polish Hill | 10 | 49 | 6 | 22 | A | |
| Fairywood | 22 | 27 | 3 | 22 | A | |
| Arlington Heights | 31 | 16 | 6 | 24 | A | |
| Esplen | 16 | 48 | 10 | 25 | A | |
| Allegheny West | 15 | 53 | 10 | 26 | A | |
| Oakwood | 24 | 37 | 8 | 26 | A | |
| Windgap | 19 | 59 | 7 | 30 | A | |
| East Carnegie | 14 | 91 | 1 | 36 | A | |
| Morningside | 22 | 77 | 6 | 37 | A | |
| West End | 28 | 60 | 25 | 37 | A | |
| Friendship | 21 | 84 | 7 | 39 | A | |
| Glen Hazel | 35 | 62 | 3 | 40 | A | |
| Duquesne Heights | 25 | 80 | 12 | 40 | A | |
| Summer Hill | 28 | 76 | 18 | 41 | A | |
| Hays | 38 | 65 | 22 | 44 | A | |
| Terrace Village | 45 | 55 | 14 | 45 | A | |
| Chateau | 28 | 85 | 38 | 46 | A | |
| Point Breeze North | 29 | 98 | 8 | 48 | A | |
| Banksville | 30 | 112 | 17 | 53 | A | |
| Mount Oliver | 62 | 67 | 20 | 59 | A | |
| Arlington | 59 | 80 | 15 | 61 | A | |
| Westwood | 45 | 107 | 18 | 61 | A | |
| South Shore | 45 | 101 | 37 | 61 | A | |
| Upper Lawrenceville | 52 | 94 | 19 | 61 | A | |
| West Oakland | 47 | 103 | 24 | 61 | A | |
| Point Breeze | 31 | 138 | 15 | 62 | A | |
| Upper Hill | 54 | 98 | 19 | 64 | A | |
| California Kirkbride | 71 | 68 | 18 | 65 | A | |
| Fineview | 73 | 64 | 27 | 65 | A | |
| Spring Hill | 67 | 84 | 22 | 67 | A | |
| Spring Garden | 51 | 118 | 19 | 68 | B | |
| Bedford Dwellings | 78 | 68 | 22 | 69 | B | |
| Greenfield | 36 | 165 | 13 | 73 | B | |
| Lincoln Place | 52 | 144 | 16 | 76 | B | |
| Lower Lawrenceville | 53 | 148 | 22 | 78 | B | |
| Overbrook | 60 | 136 | 16 | 78 | B | |
| Strip District | 55 | 149 | 26 | 80 | B | |
| Middle Hill | 85 | 105 | 40 | 87 | B | |
| Squirrel Hill North | 51 | 179 | 22 | 87 | B | |
| Allegheny Center | 78 | 116 | 58 | 87 | B | |
| Stanton Heights | 48 | 195 | 19 | 89 | B | |
| Northview Heights | 98 | 102 | 13 | 91 | B | |
| Troy Hill | 76 | 142 | 23 | 91 | B | |
| Crawford Roberts | 77 | 137 | 38 | 91 | B | |
| Beltzhoover | 91 | 114 | 48 | 94 | B | |
| North Shore | 74 | 162 | 61 | 99 | B | |
| Central Lawrenceville | 60 | 205 | 26 | 100 | B | |
| Manchester | 92 | 141 | 33 | 101 | B | |
| Bluff | 86 | 170 | 65 | 109 | B | |
| North Oakland | 62 | 231 | 46 | 111 | B | |
| Garfield | 109 | 152 | 22 | 113 | B | |
| Crafton Heights | 115 | 141 | 18 | 113 | B | |
| South Oakland | 79 | 226 | 31 | 118 | B | |
| East Hills | 130 | 144 | 21 | 124 | B | |
| Hazelwood | 109 | 187 | 42 | 126 | B | |
| Homewood West | 131 | 151 | 43 | 128 | B | |
| Central Oakland | 52 | 315 | 44 | 130 | B | |
| Perry North | 124 | 177 | 34 | 131 | B | |
| Elliott | 99 | 232 | 34 | 133 | B | |
| Larimer | 128 | 183 | 29 | 135 | C | |
| Central North Side | 101 | 244 | 45 | 138 | C | |
| Highland Park | 119 | 226 | 44 | 144 | C | |
| Squirrel Hill South | 57 | 356 | 40 | 145 | C | |
| Perry South | 155 | 175 | 30 | 149 | C | |
| Allegheny West | 143 | 196 | 72 | 152 | C | |
| Lincoln Lemington Belmar | 115 | 276 | 22 | 154 | C | |
| East Allegheny | 125 | 254 | 98 | 161 | C | |
| Knoxville | 159 | 222 | 54 | 168 | C | |
| Shadyside | 60 | 428 | 42 | 169 | C | |
| Homewood South | 162 | 231 | 43 | 171 | C | |
| Beechview | 142 | 269 | 70 | 173 | C | |
| Marshall Shadeland | 146 | 269 | 55 | 174 | C | |
| Brighton Heights | 166 | 309 | 38 | 196 | C | |
| Mount Washington | 122 | 407 | 42 | 199 | C | |
| Homewood North | 212 | 253 | 58 | 209 | D | |
| Bloomfield | 124 | 454 | 37 | 214 | D | |
| Sheraden | 147 | 423 | 62 | 222 | D | |
| Brookline | 170 | 403 | 67 | 230 | D | |
| South Side Slopes | 162 | 518 | 140 | 267 | D | |
| East Liberty | 250 | 458 | 64 | 294 | F | |
| Carrick | 306 | 591 | 94 | 371 | F | |
| South Side Flats | 253 | 652 | 245 | 372 | F | |
| Central Business District | 314 | 977 | 207 | 502 | F | |
| Zone Totals | 1 | 2 | 3 | 4 | 5 | 6 |
| Total Violent | 1710 | 908 | 1394 | 767 | 1570 | 889 |
| Total Property | 2834 | 2254 | 3011 | 2768 | 2884 | 2045 |
| Total Drug | 710 | 505 | 748 | 383 | 415 | 347 |


